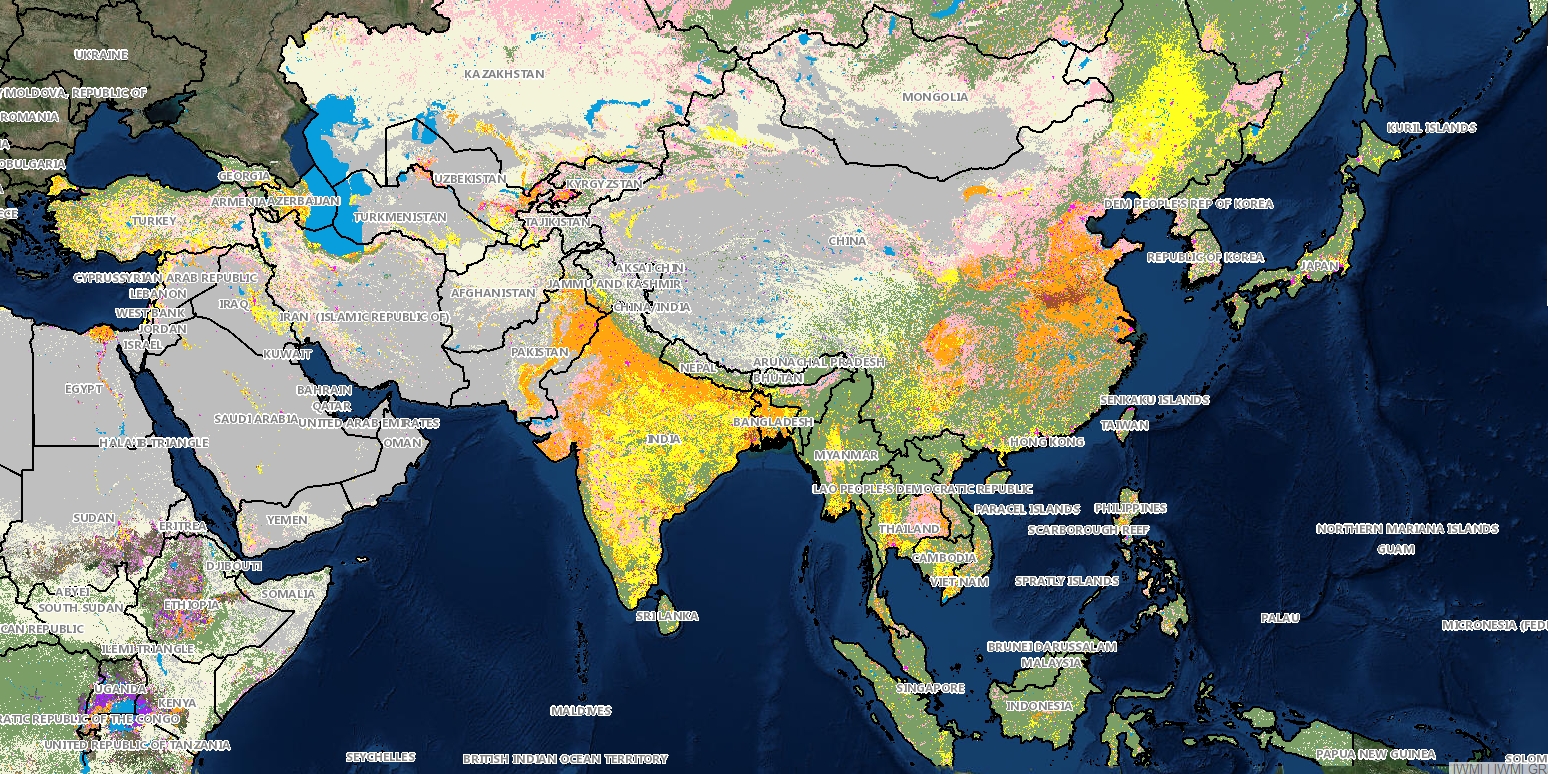
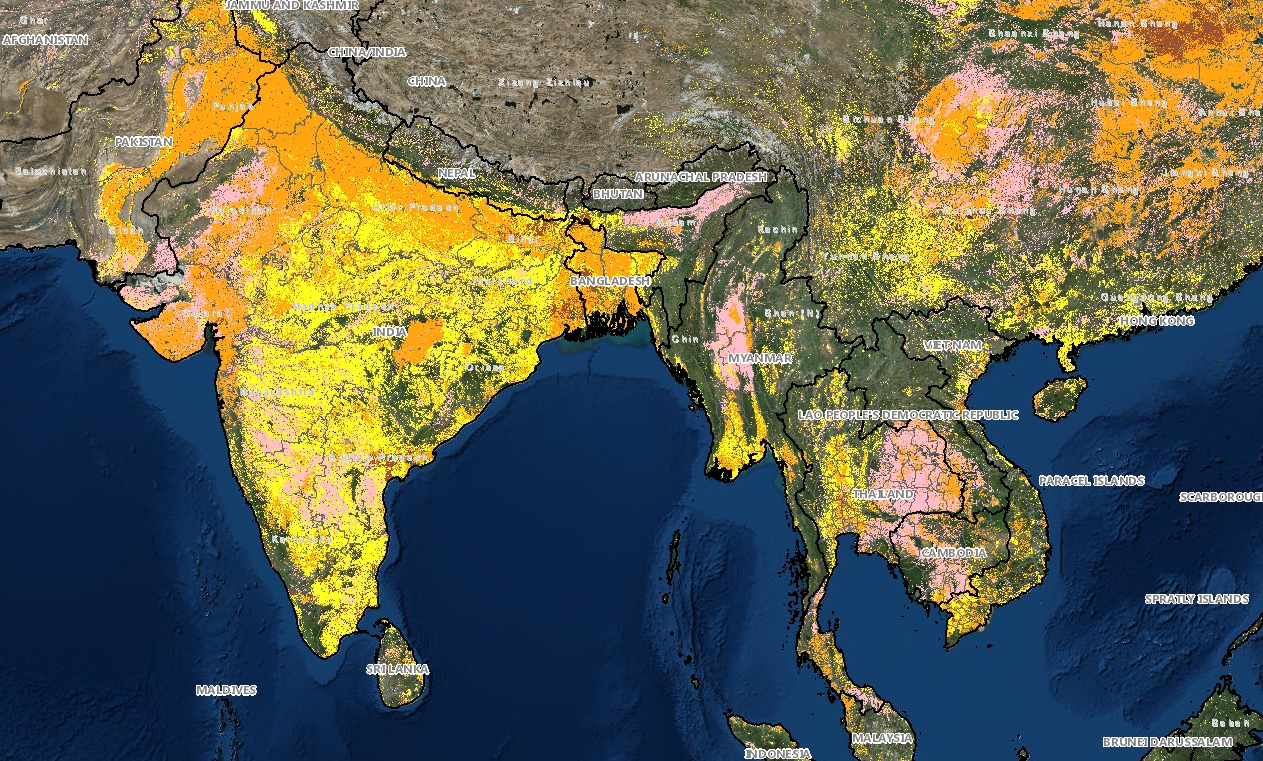
New map is most detailed to date
Irrigation has long been accepted as a vital step towards more productive food systems. However its use globally is patchy. In Africa, for instance, only about 5% of agriculture is irrigated. For a continent where much rainfall is highly seasonal, this remains a huge barrier to improved food security and better incomes for farmers. But change is afoot. Slowly but surely more and more of Africa is becoming irrigated.

It important to keep track of these changes as they will alter landscapes and affect the natural systems that support agriculture. Only by constantly monitoring the growth of irrigation, can sustainability and ecosystem health can be assured.
For policy makers, finding out just how much irrigation is going on, and exactly where this is happening is essential. If the trends can be accurately mapped and measured, then more informed investment decisions can be taken and water supply can be maintained for the long term.
Asia and Africa’s irrigated areas have been charted before, but IWMI has just released a new map that for the first time can give consistent details of land use down to 250 meters. The task was not an easy one. Remotely sensed satellite data can now shed light on what each area of land is being used for, but the huge variety of irrigated crops and the patterns in which they are farmed create a complex challenge for mappers. The process relies on measuring variations in the spectral light that different crops reflect. However these are not always significant enough to be registered from space. The latest map is based on looking at the changes in the growing cycles of plants – called phenology – which has greatly increased scientists ability to differentiate between crops over time.
“It’s a huge step forward,” says Salman Siddiqui, head of IWMI’s remote sensing team. “IWMI pioneered the onerous task of mapping global irrigated areas back in 2006, but then we only had resolution to 10 km. The new maps have improved that forty-fold.” The improved resolution means that not only are areas formally reported as being irrigated better captured, but the vast unknown extent of informal irrigation will also be identified. This hitherto undocumented irrigation development is often driven by local communities and individuals and largely absent from public records.
The phenological methodology takes a time series of images from the MODIS satellite sensors and, through advanced image processing techniques, essentially looks at a plant’s “greenness”. This is then combined with both existing and field data on the annual and semi-annual cycles of vegetation change, and information on seasonal rainfall. From this it is possible to work which agricultural areas are being irrigated and which depend solely on rain.
The maps provide a wealth of information to support regional and national policy and investment options to tackle food security and economic growth. For instance, preliminary analysis of Ethiopia shows the area under irrigation as 4.1 million ha, 14 times greater than formally reported. Broadly in Africa the areas receiving improved water management practices including irrigation are about 2 to 3 times greater than was previously thought. About half of these areas have some level of active water management which is beyond traditional definition of “rainfed” but not yet “irrigated”. These areas are usually developed through local community initiatives, which are rarely recognized in formal reporting. A better understanding the effects of such initiatives could help improve the setting of development targets for food security, and water resources development, as outlined in the new UN Sustainable development goals. Such maps also provide more detailed information on how human activities change the boundaries of natural and modified ecosystems.

The new map has the potential to enhance accurate irrigation assessments at continental, regional and national levels. As the technology progresses, the team hope to move to even higher resolutions, possibly up to 15 meters. That would enable individual fields or farms to be identified.
The researchers, however, urge a note of caution.
“We need to acknowledge uncertainties in our products,” says Cai Xueliang, lead scientist on the mapping team. “Other approaches, such as using census data are also important. This tool is designed to support and supplement other information systems rather than replace or compete with them. There is a role for both. We will not always be able to be 100% accurate, and accounting for informal irrigation and other new developments will remain a challenge.”
“We should acknowledge that decisions based on a single approach are unlikely to be completely accurate,” he adds. “Rather, what maps like this show is essentially a range of probabilities. That still makes it a useful tool, but it should not be taken as precise mirror of ground conditions.”
View the Irrigated Area Map Asia(2000-2010) and Africa(2010)
Disclaimer: This product is currently undergoing testing and further development. Whilst every care has been taken to ensure its accuracy, it remains an approximate representation of ground conditions and should not be seen as a definitive guide. IWMI anticipates that the accuracy of this mapping system will improve as more data is collected.
This work is supported by the CGIAR Research Program on Water Land and Ecosystems (WLE)

