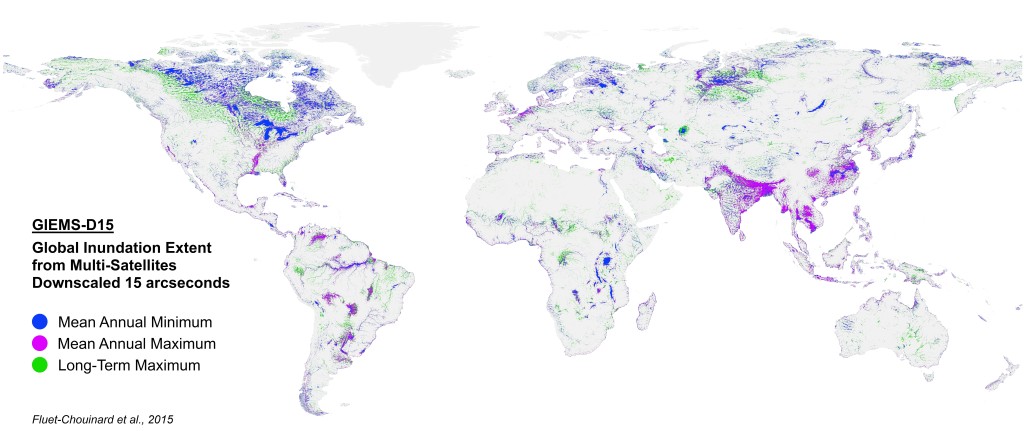
A new method of measuring the extent of the world’s wetlands gives scientists a clearer view of where these watery landscapes lie.
[pullquote type=”pullquote5″ content=”Data that characterizes the dynamic nature of wetlands is crucial for the study of large floodplain and wetland ecosystems” quote_icon=”yes” align=”right” textcolor=”#3ba739″]Data that characterizes the dynamic nature of wetlands is crucial for the study of large floodplain and wetland ecosystems[/pullquote]
Measuring a wetland might seem relatively straightforward but it can be more like a game of hide-and-seek.
That’s because wetlands are dynamic. They move; they change shape; they expand and contract with the seasons – and the intensity of the seasons. They can hide under vegetation, be hard to access and difficult to navigate. A wetland can even be dry land depending on when you observe it.
It’s partly this dynamism that makes wetlands so ecologically important. But it can also make it difficult to manage them sustainably.
Now scientists at the International Water Management Institute (IWMI), through a project led by McGill University, have contributed to what is probably the most authoritative map of the world’s wetlands.
Generated from satellite images taken over a twelve-year period, the high-resolution map distinguishes between permanent and temporary wetlands, and measures patterns of inundation – the extent to which the areas hold water over time. It means that for the first time they can answer the question “Is it a wetland?” on a scale of probability.
“The difficulty with wetland mapping is that wetlands are neither always wet, nor always dry,” said Lisa-Maria Rebelo, a remote sensing expert at IWMI who helped develop the new map. “A snapshot of what is wetland at a particular point in time holds little value.”
“For example, a close look at two of the world’s largest inland wetlands, the Sudd in South Sudan, or the Tonle Sap in Cambodia, shows the large changes that take place between the wet and dry seasons in a single year, let alone the variations in the flood patterns that occur between a wet and a dry year.”
“Data that characterizes the dynamic nature of wetlands is crucial for the study of large floodplain and wetland ecosystems, and the accurate assessment of global freshwater resources. Without them it is impossible to guide policies related to their wise-use, or to ensure that the ecosystem services which they provide are not being compromised.”

Download the high resolution version in PDF format (24MB)
[hr top=”yes”/]

