Satellite scans of vegetation show changes to the sub-continent’s land-use
With land degradation, habitat loss and urbanization increasing in India, new interactive maps could help policymakers monitor and protect the country’s biodiversity hotspots.
The maps document different types of vegetation cover across every state in the country, as a proxy for biodiversity richness. They replace existing maps that were almost 50-years-old.
“Of course, India was quite a different place in the late sixties when the first – and until now the country’s only – vegetation maps were developed,” said Amarnath Giriraj, a remote sensing and water resources expert at the International Water Management Institute (IWMI), who was part of the team that produced the new maps.
“The earlier maps predate the Green Revolution, rapid industrial growth and India’s population explosion. In addition, the technology used to produce these maps was extremely limited. We now have a much more accurate and comprehensive baseline for monitoring changes in land use and vegetation cover nationwide,” he continued.
Giriraj helped produce the maps while working at the National Remote Sensing Centre of the Indian Space Research Organisation, in Hyderabad, India. He was part of a network of almost 100 scientists from 48 institutions working on the maps, with experts including remote sensing and global information systems specialists, geographers, and social scientists.
“Being involved in such a large-scale mapping program has enabled me to develop new skills in applying remote sensing procedures to studies of floods and droughts. It has also allowed me to establish new partnerships that have contributed significantly to IWMI’s ongoing research“
The new maps were developed using satellite images and information on biophysical conditions, climates and soils to classify 100 different vegetation types and their distribution across the country. The work required the combined effort of almost 100 scientists from 48 institutions, with experts including remote sensing and global information systems specialists, geographers, and social scientists. The maps are believed to be around 90% accurate, based on extensive field-level checks.
The maps can be viewed here. http://bis.iirs.gov.in/
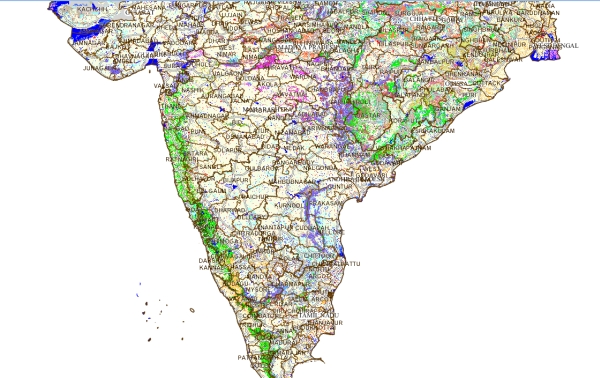
They clearly show India’s biodiversity-rich Western Ghats, for example, a 1,600 km-long sliver of escarpment that hugs the country’s Arabian Sea coast, represented by bright green. At the opposite end of the scale, areas with low biodiversity richness are represented in blue, such as the desert regions of western Rajasthan and Gujarat. Users can select to overlay additional information to reveal the vegetation type.
One specific use will be to see how vegetation cover and distribution is affected by climate change. This could enable policymakers to respond quickly to challenges and develop site-specific interventions.
In addition to the maps, the team developed biodiversity database to act as a baseline for monitoring progress towards achieving targets set out in the Convention on Biological Diversity 2020, to which India is a signatory.
To find out more about how the maps were developed and what they show, see the recent paper published in the International Journal of Applied Earth Observation and Geoinformation: http://www.sciencedirect.com/science/article/pii/S0303243415000574