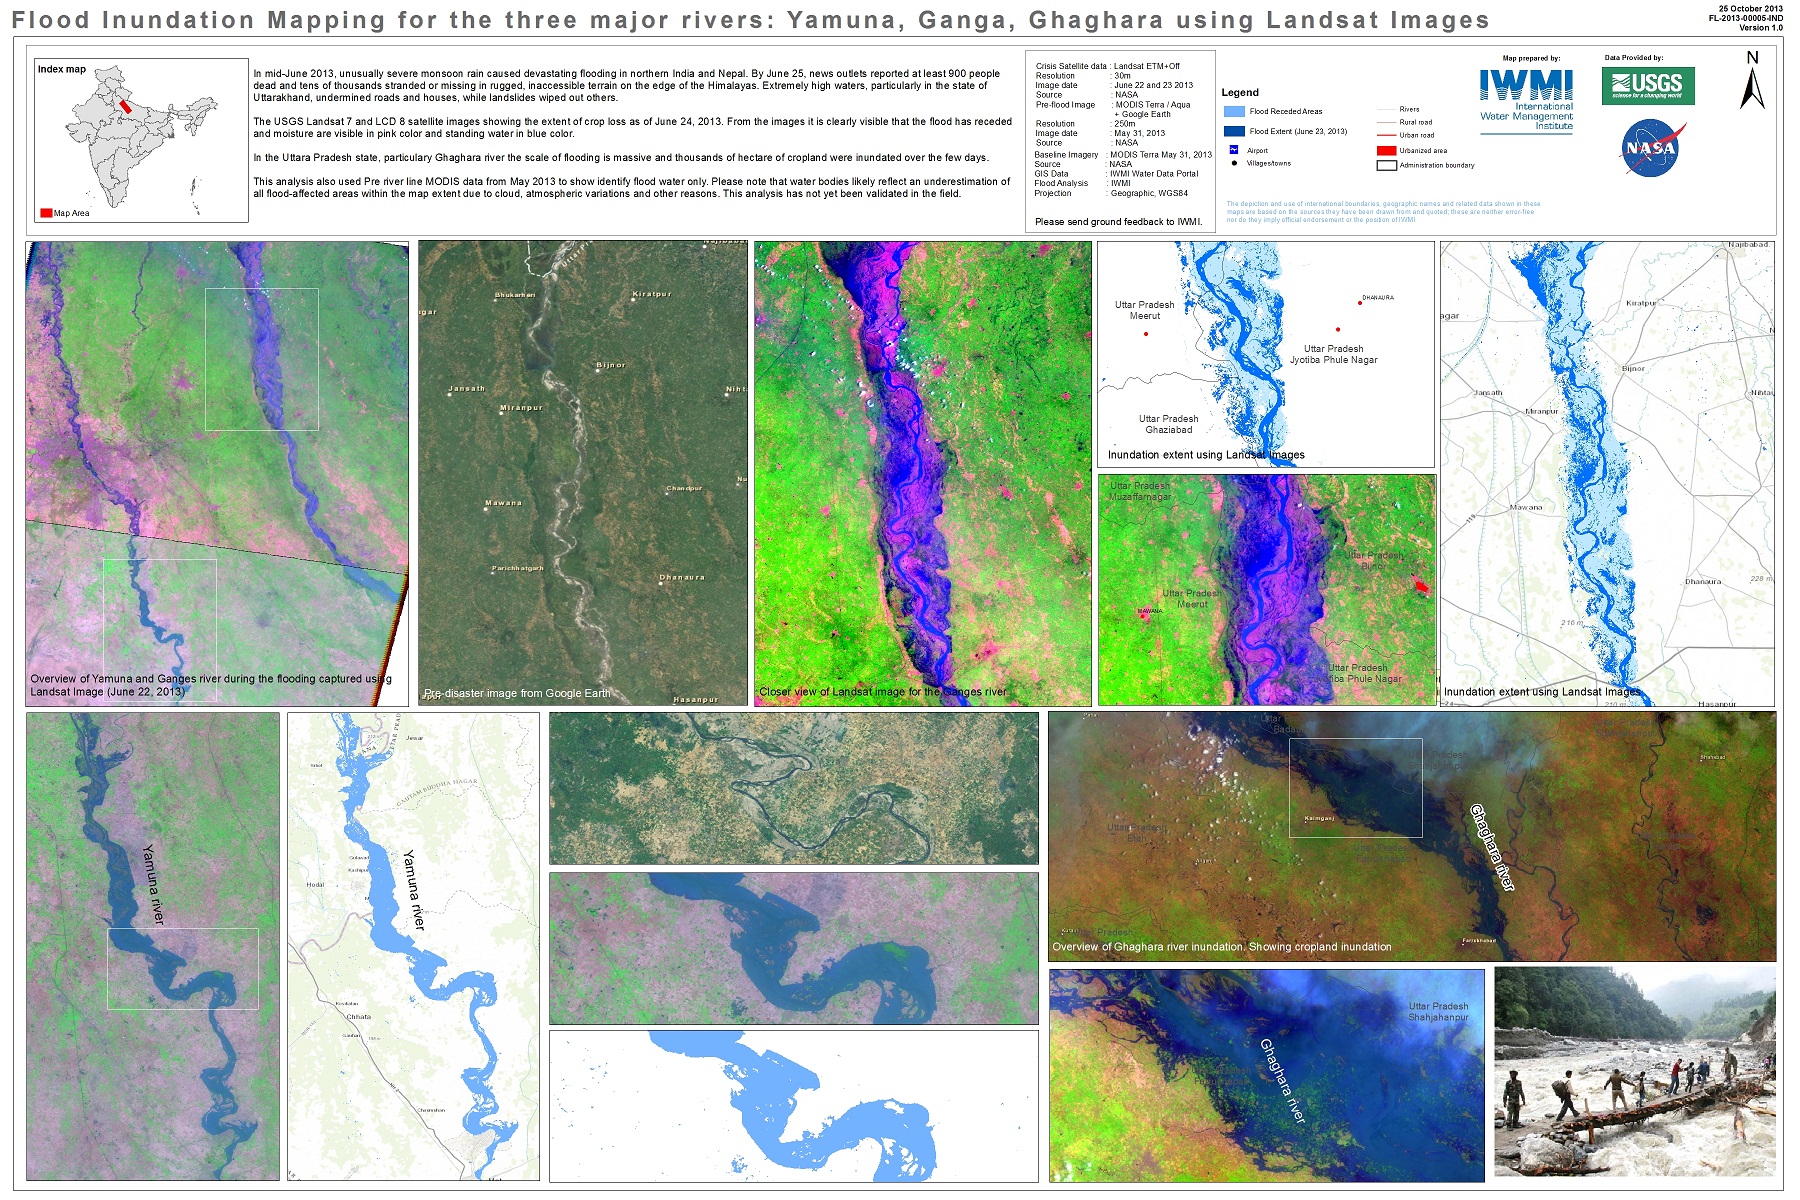
Update on flood situation in Uttara Pradesh (India) using Landsat 30m resolution.
(26 June 2013)
Image clearly shows flood receded areas in pink color and standing water in blue color. Further image clearly depict extent of crop loss in along the floodplains.
[hr top=”no”/]
Heavy monsoon rains have arrived early this year in northern India causing severe floods. The pilgrimage shrine of Kedarnath and the surrounding region in the high Himalayas in the Indian State of Uttarakhand have been hit hardest. The extremely high water crushed houses and swept away roads and bridges while landslides wiped out others.
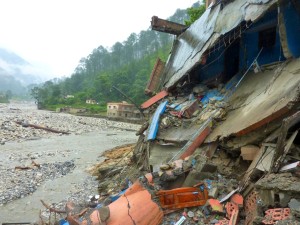
Photo: EU Humanitarian Aid and Civil Protection on Flickr
It has been reported that the floods caused the deaths of more than 600 people. More than 40,000 are still thought to be stranded or missing in isolated terrain on the edge of the Himalayas. Efforts are underway to rescue survivors by helicopter from the worst-hit areas, but search and rescue efforts will need to ramp up as more rain is expected.
The International Water Management Institute (IWMI) is contributing to the relief coordination through the preparation of flood inundation maps. Researchers captured and mapped the impacts of the floods using satellite images and supplied the maps to the Indian National Disaster Management Authority as well as to the United Nations Office for Outer Space Affairs (UNOOSA) for wider dissemination.
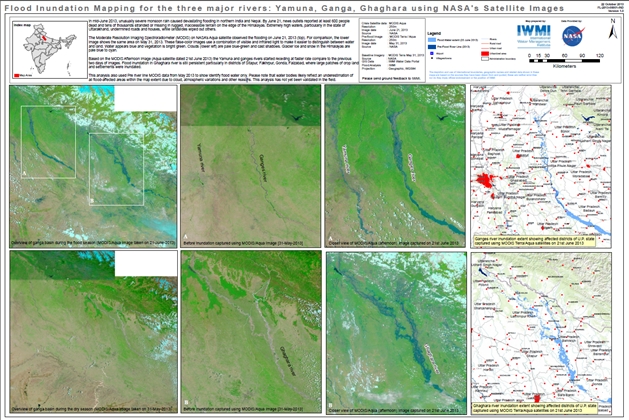
The maps were created using satellite images observed by the Moderate Resolution Imaging Spectroradiometer (MODIS) on NASA’s Aqua satellite.
“We were able to provide four maps altogether to the authorities in charge”, says IWMI researcher Giriraj Amarnath. ”Our rapid emergency response mapping provides information that can help disaster authorities with relief coordination by giving information about the current flood situation, flood duration, flood direction, showing villages and croplands that are affected.”
About the author:
Anna Deinhard is a Communications Fellow at the International Water Management Institute (IWMI). She has an MSc in Environmental Sciences from Linkoping University in Sweden, with a specialization in water and development.